Developer Tools 3.0.0
SailCMS comes with a nice toolbox for developers. It offers a few ways to debug your code. Here is what we support and how to use it.
Spatie's RAY
Spatie.be has a great tool called Ray. You can download the client for a trial or buy a license. It is a very useful and clean way to debug your app without having print_r or var_dump everywhere.
You can use the ray method from anywhere, but if you want syntactic sugar on top, call Debug::ray. The debug version offers a quick way to print out data with a specific color for debug/log, success, warning/warn, critical/error.
Debug::ray('var1', $var2, $var3, 'warning');
The last argument is the type of logging you want to have in Ray. If your last argument is not a valid color category, it will default to debug.
Ray is also used in the Debug::printOut method, if ray is enabled.
Whoops
Whoops is the default exception catcher for SailCMS. It will give you everything you need to know about what just happened.
Clockwork Support
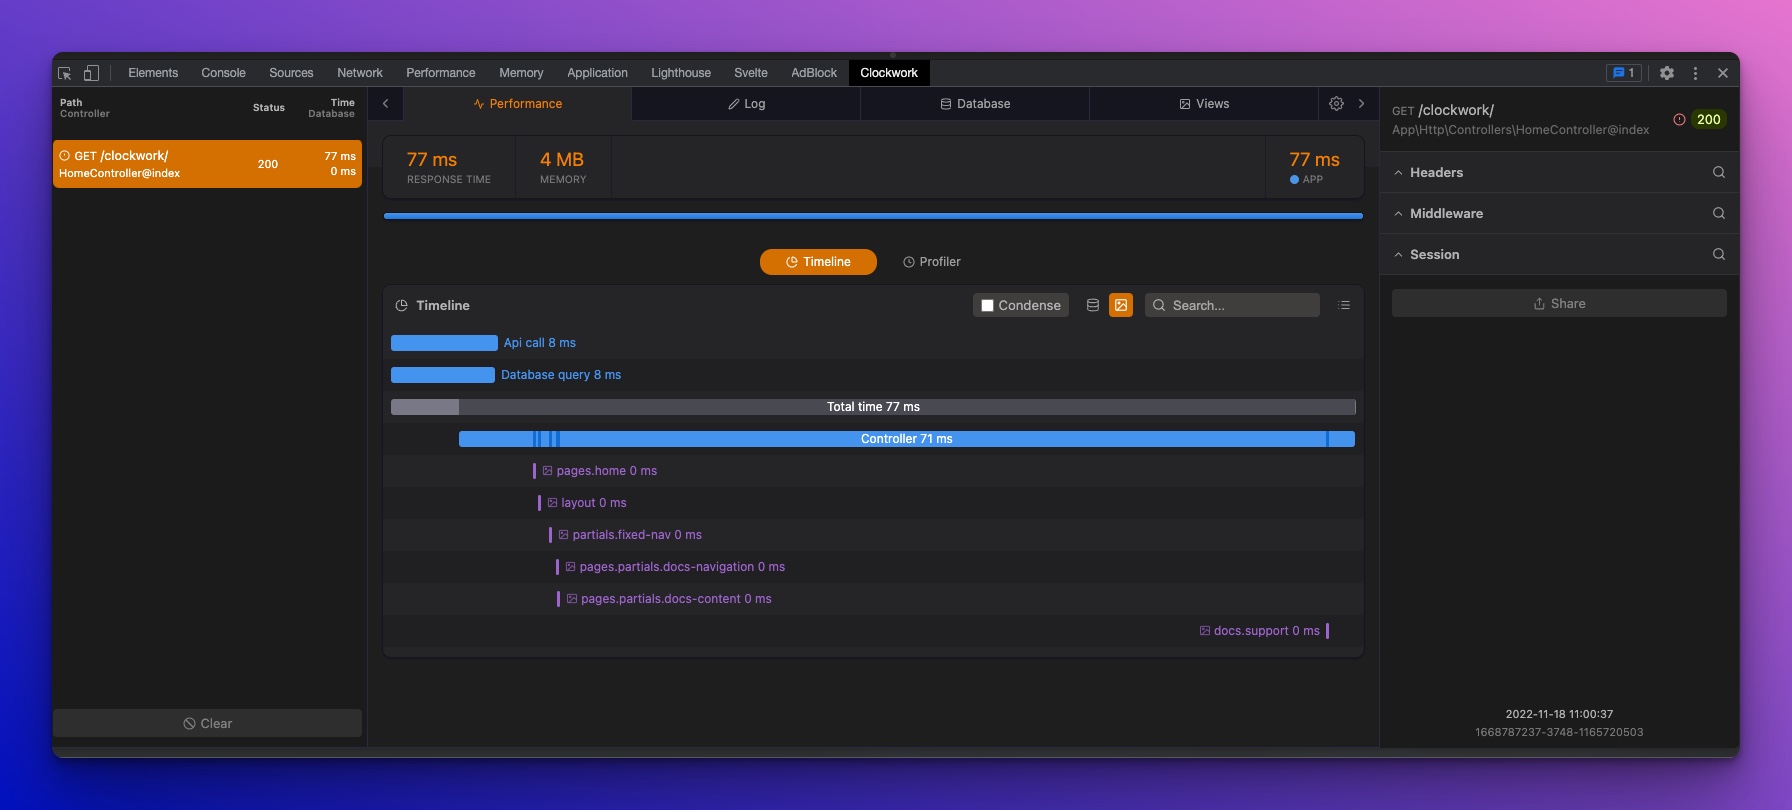
We have support for the Clockwork browser extension. If activated using the DEBUG environment variable. SailCMS will log the lifecycle of the cms, will time the time taken by loading of modules, containers, views, among other things. But we go a step further. Since Clockwork only supports SQL like database for its database profiler, we convert most mongodb queries to a SQL like string, so you can enjoy the profiler with SailCMS.
You can also use it within your code. Simply call one of the supported methods:
Debug::log(...$messages);
Debug::info(...$messages);
Debug::warn(...$messages);
Debug::error(...$messages);
Here is what the UI of the browser extension looks like:

Old school debugging
You can also go old school and use Debug::dd and Debug::dump. The first one is "Dump and Die", meaning it will output the variables you want to be displayed, displays them nicely and then kill your page. The second, does the same thing but does not kill your page.